Release health for AI-built apps: let every build carry its verdict

Your app launched, the first strangers are using it, and now the only question that matters is whether each new build makes things better or worse. Crash counts cannot answer that — a release with twice the users and twice the crashes can still be healthier than the one before it. Release health answers it properly: the share of users and sessions that survive each version crash-free, tracked per release, compared against the one before. If you instrument one production metric this month, make it this one.
Release health is not another dashboard to admire. It is the acceptance test for every build you ship from here on: a release that drops crash-free users below your baseline does not get a follow-up feature, it gets a fix. That discipline is what separates teams that scale from teams that accumulate incidents, and it takes an afternoon to set up.
Track users and sessions, not crashes
Raw crash counts mislead because they scale with adoption. A launch spike doubles your crashes while your app gets healthier — more users, same failure rate. Rates fix the denominator: crash-free users (what share of people never hit a crash on this version) and crash-free sessions (what share of app opens complete cleanly). When both hold steady across a release that doubles traffic, the release is healthy no matter what the absolute count says.
The tooling for this is a release tag plus session tracking, and the semantics are worth stating precisely. Sentry defines a release as a version of your code deployed to an environment, and its release view surfaces adoption, crash-free users, and crash-free sessions per version. Release health monitoring adds the trend layer: user adoption, application usage, crash percentages, and session data per release, so each new version can be read against the last. One terminological care point from those same docs: the sessions used for health math are not the same thing as Session Replay recordings — health sessions are lightweight counters, replays are video-like reproductions, and confusing the two leads to surprising bills and wrong conclusions.
Set your baseline before you need it. Record crash-free users and sessions for the current build during a quiet week, write the numbers down, and make them the bar every future release clears. That baseline habit is the same one the launch checklist asks for at the release-wiring gate — this post is the ongoing practice behind that one-time setup.
Read both stores' quality signals, not just your tracker
Your own instrumentation covers what your SDK sees. The stores see more: every install, every startup, every slow frame, including on devices and OS versions your test matrix never touched. Check both consoles on a cadence — weekly is enough for most apps — and treat their numbers as the outside view that keeps your inside numbers honest.
On Android, that outside view has a name. Android vitals surfaces stability, performance, battery usage, and more, with dedicated overview and Crashes-and-ANRs pages in Play Console plus a reporting API for wiring the data into your own workflows. Those console pages now also carry prioritized insights and recommendations for quality issues, which is a ready-made triage order when you open them. The practical move is comparing vitals against your tracker's per-release rates: when both agree a release is clean, ship the next one with confidence; when they disagree, believe the worse number and investigate. Frozen screens users force-close barely register in crash-only tooling but show up plainly in vitals — hangs users kill are invisible to counters that only watch for exceptions.
On iOS, the equivalent is the crash and responsiveness data in the developer console: per-version crash counts, hang rates, and battery/memory diagnostics. Same cadence, same comparison against your own per-release numbers. The pattern is identical on both platforms — two independent instruments, one verdict.
11 production screens. Login and database wired.
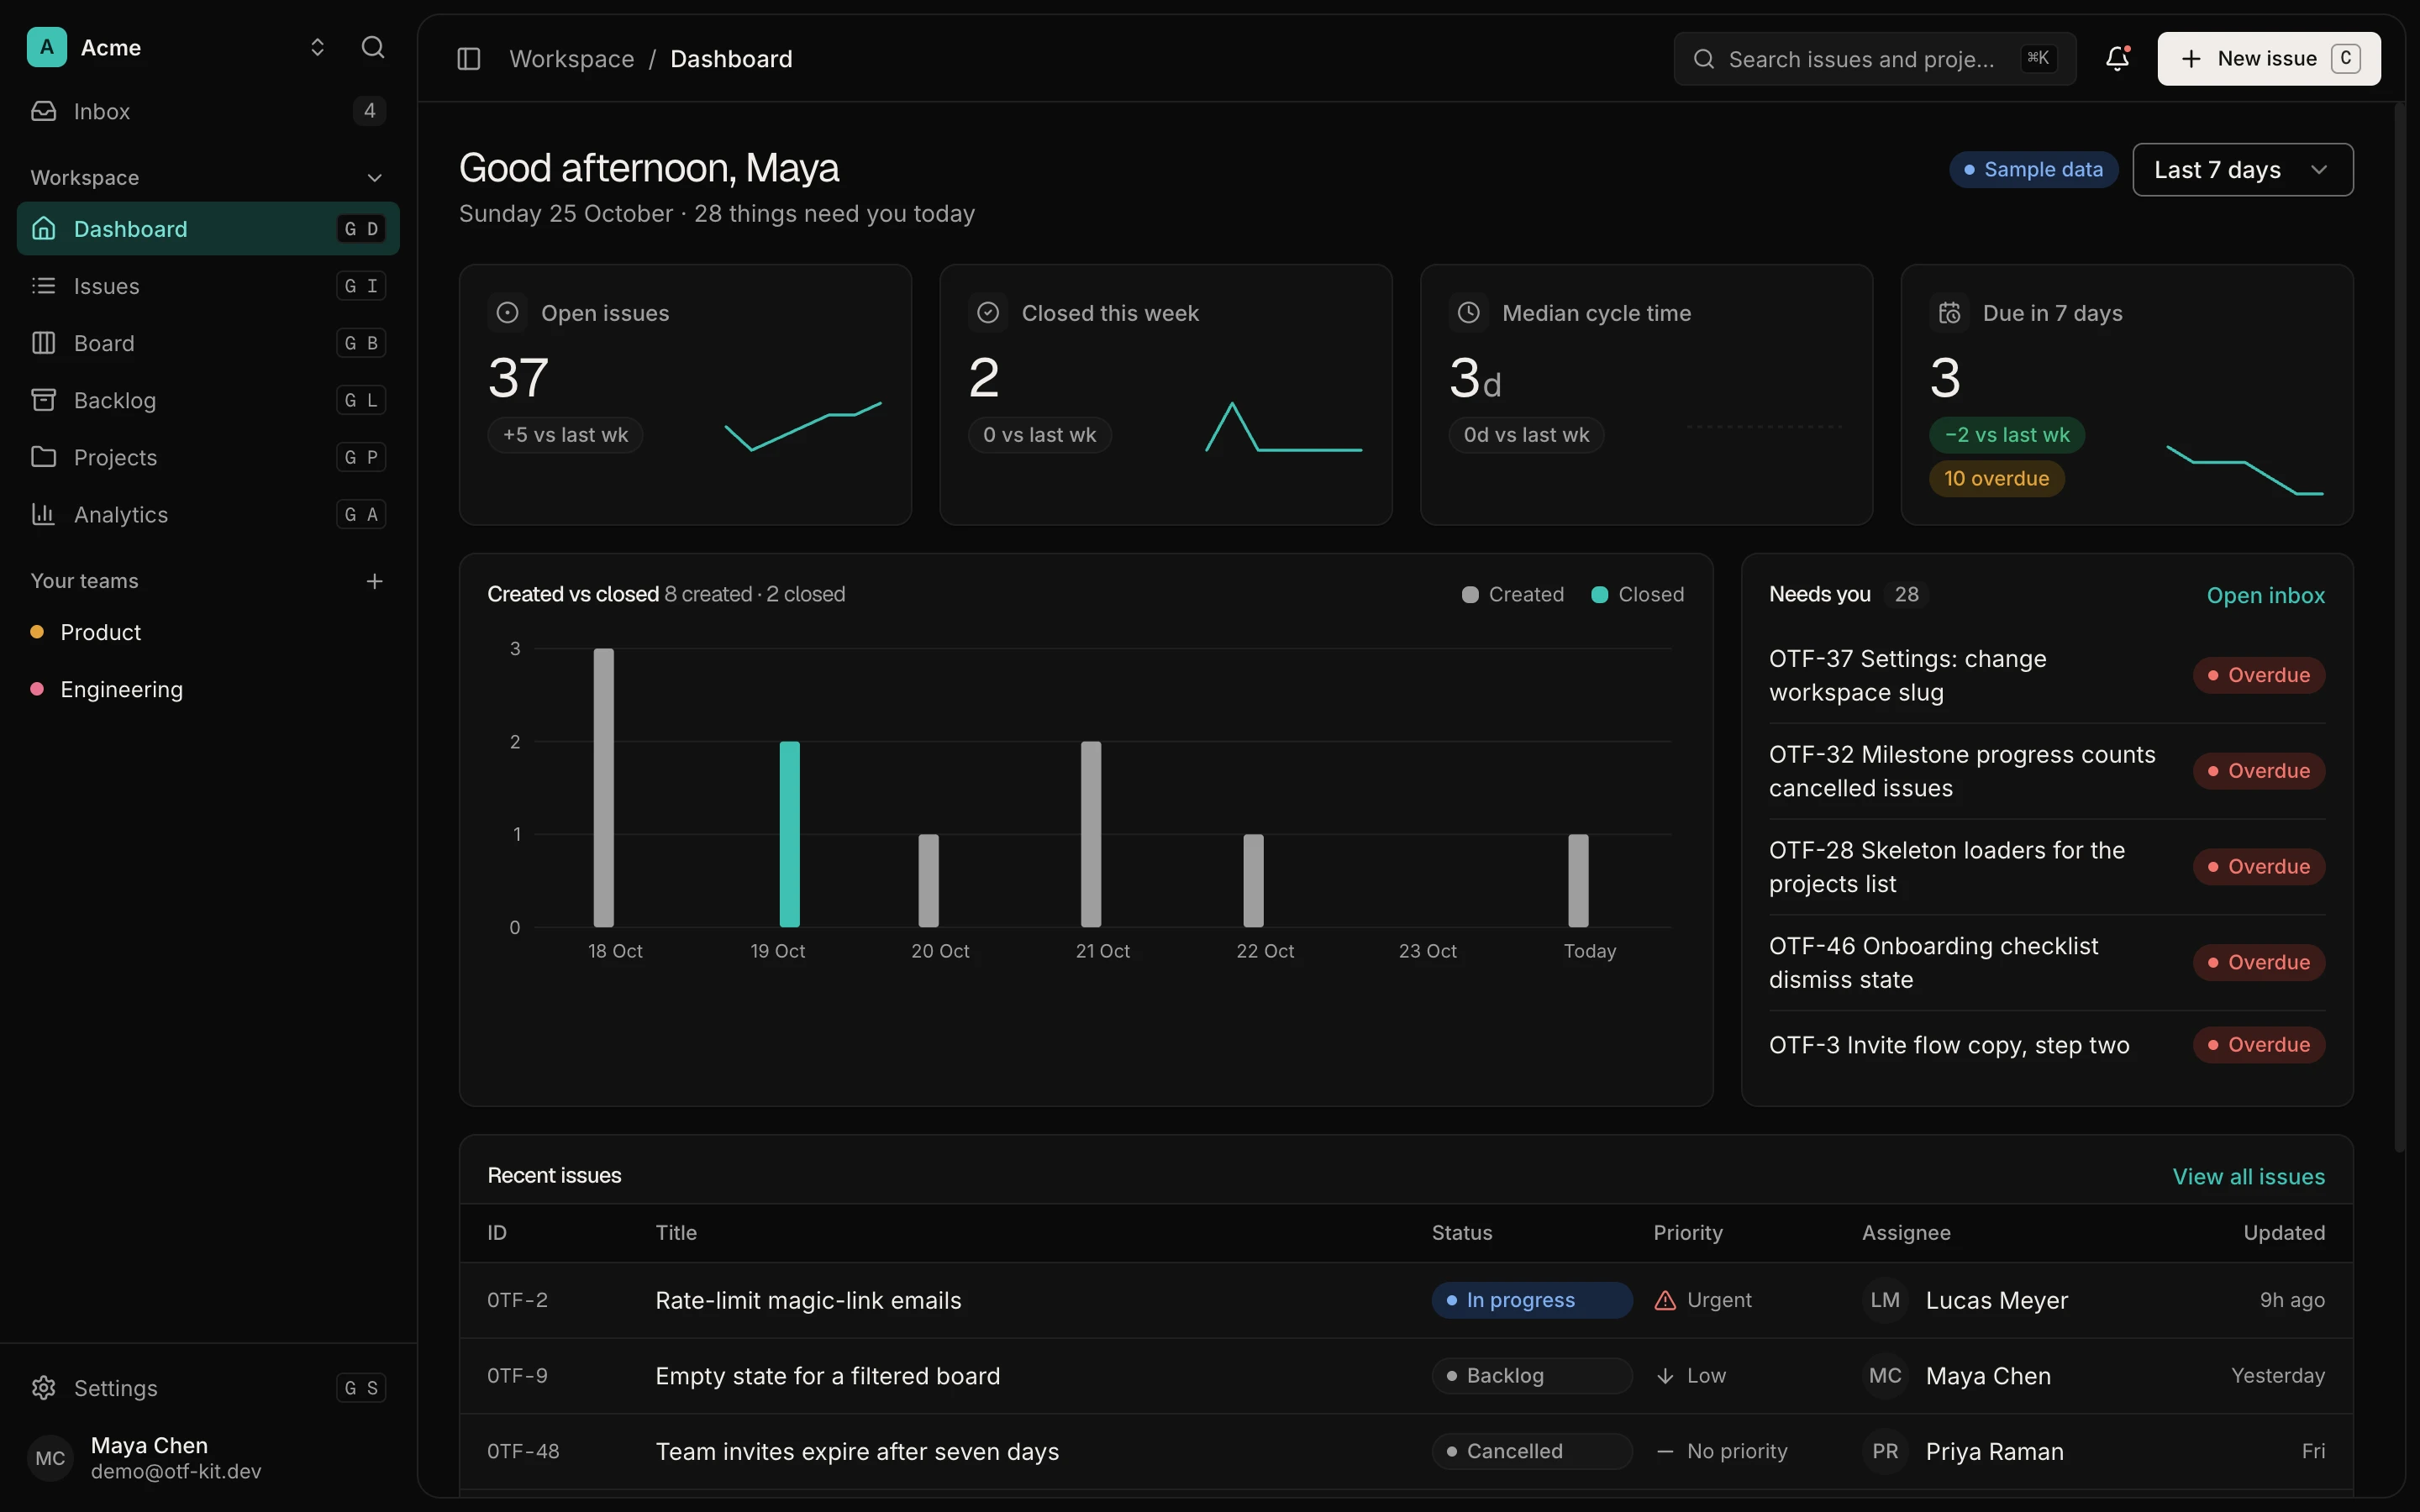
The SaaS Dashboard Kit includes login, a database, and a working dashboard. Live demo at saas.otf-kit.dev.
Alert on the rate, not the count
Dashboards fail the same way crash counts do: nobody watches them at 2 AM. A health practice needs alerts tied to the rates, not the absolutes — notify when crash-free users for the newest release drops below baseline by more than your tolerance, not when total crashes cross some round number that launch traffic would trip anyway. Since release health data flows through releases, release details, and search across the tracker, the alert can point at the exact version and its adoption curve, which is what makes the 2 AM message actionable instead of alarming.
Set two alerts and no more. The first fires when the newest release underperforms baseline within its first day — that is the rollback trigger. The second fires when any older release still serving users degrades — that is the hotfix trigger for the long tail on old versions. Everything else is a dashboard you review weekly. Alert fatigue kills health practices faster than missing instrumentation: if the alerts fire on noise, the team mutes them, and you are back to arguing about crash counts. Tune the tolerance from real data — start wide in the first month, tighten once you know what normal variance looks like for your app.
Make the release the unit of quality decisions
Once per-release health exists, reorganize your shipping rhythm around it. Every release gets a health reading 24 to 48 hours after rollout: crash-free users vs baseline, crash-free sessions vs baseline, store vitals vs your tracker. Three outcomes, three responses. Green across the board: proceed with the next feature. One metric dipped: the next change is a fix for the regression, nothing else lands until it recovers. Multiple metrics red: roll back to the previous build and diagnose off the live path.
This is also where the tracing story connects: when AI features drive a growing share of sessions, per-release health tells you whether the new model version, prompt change, or agent behavior moved the numbers. Tag AI-impacting changes in the release notes so the health reading can be attributed — "crash-free sessions dipped on the release that changed the support copilot" is an actionable sentence, and it only exists if the release is the unit of analysis. The error-tracking foundation underneath all of this is already covered; health is the layer that turns tracked errors into shipping decisions.

Start this afternoon
The setup is small: tag every build with a version, confirm session data flows into the per-release view, record the baseline, add both store consoles to a weekly check, and set the two rate alerts. None of it requires new vendors or architecture — it requires treating the release as the thing you measure, instead of the crash.
Starting from owned code helps, because health instrumentation lives in the seams: the version tag, the SDK init, the release notes. Begin from the verified templates page, wire health before the next release, and every build from here on carries its own verdict.
Sources
Ship the product, not the setup.
- 11 production screens — auth, team, analytics, and settings
- Login and a real database are wired in
- AI configs pre-tuned so your agent extends instead of regenerates
Ship your first screen tonight — free starter in your inbox
The quickstart, the SDK repo and the live kit demos, on this screen and in your inbox.
No spam. Unsubscribe any time.