How to build an analytics dashboard with AI you actually own

Hosted BI canvases and embedded chart builders are excellent at one job: put metrics in front of stakeholders without asking anyone to own a product repository. That loop is real for a disposable ops view or a one-off executive board.
It is the wrong system of record when the analytics surface is the product. Customers and operators need metrics schema, charts, and alerts inside software you brand, deploy, and keep changing. Renting a canvas or a BI workspace forever leaves those surfaces on a vendor host — and leaves Cursor or Claude Code without project memory beside the screens.
The saas-dashboard kit answers that narrower job. You already use a filesystem agent. You need an analytics app as ordinary source agents can extend. This post is a how-to for that build order: metrics schema first, then charts, then alerts you keep, then agents. It is not another internal-tools platform comparison — for that contrast see Retool and Appsmith fit internal tools; a SaaS dashboard kit owns the product repo. It is also not the admin panel how-to and not a finance-dashboard feature laundry list. Those buyer questions already have posts. This one is how to build owned analytics.
What the kit actually ships for analytics work
OTF lists the SaaS Dashboard Kit on https://otf-kit.dev/templates/saas-dashboard and in the kit table on https://otf-kit.dev/docs/templates/overview. Standalone price is $99; also in the Everything Bundle on https://otf-kit.dev/pricing. Live proof before checkout: https://saas.otf-kit.dev. Kit docs: https://otf-kit.dev/docs/templates/saas-dashboard.
Public product claims that matter for an analytics product:
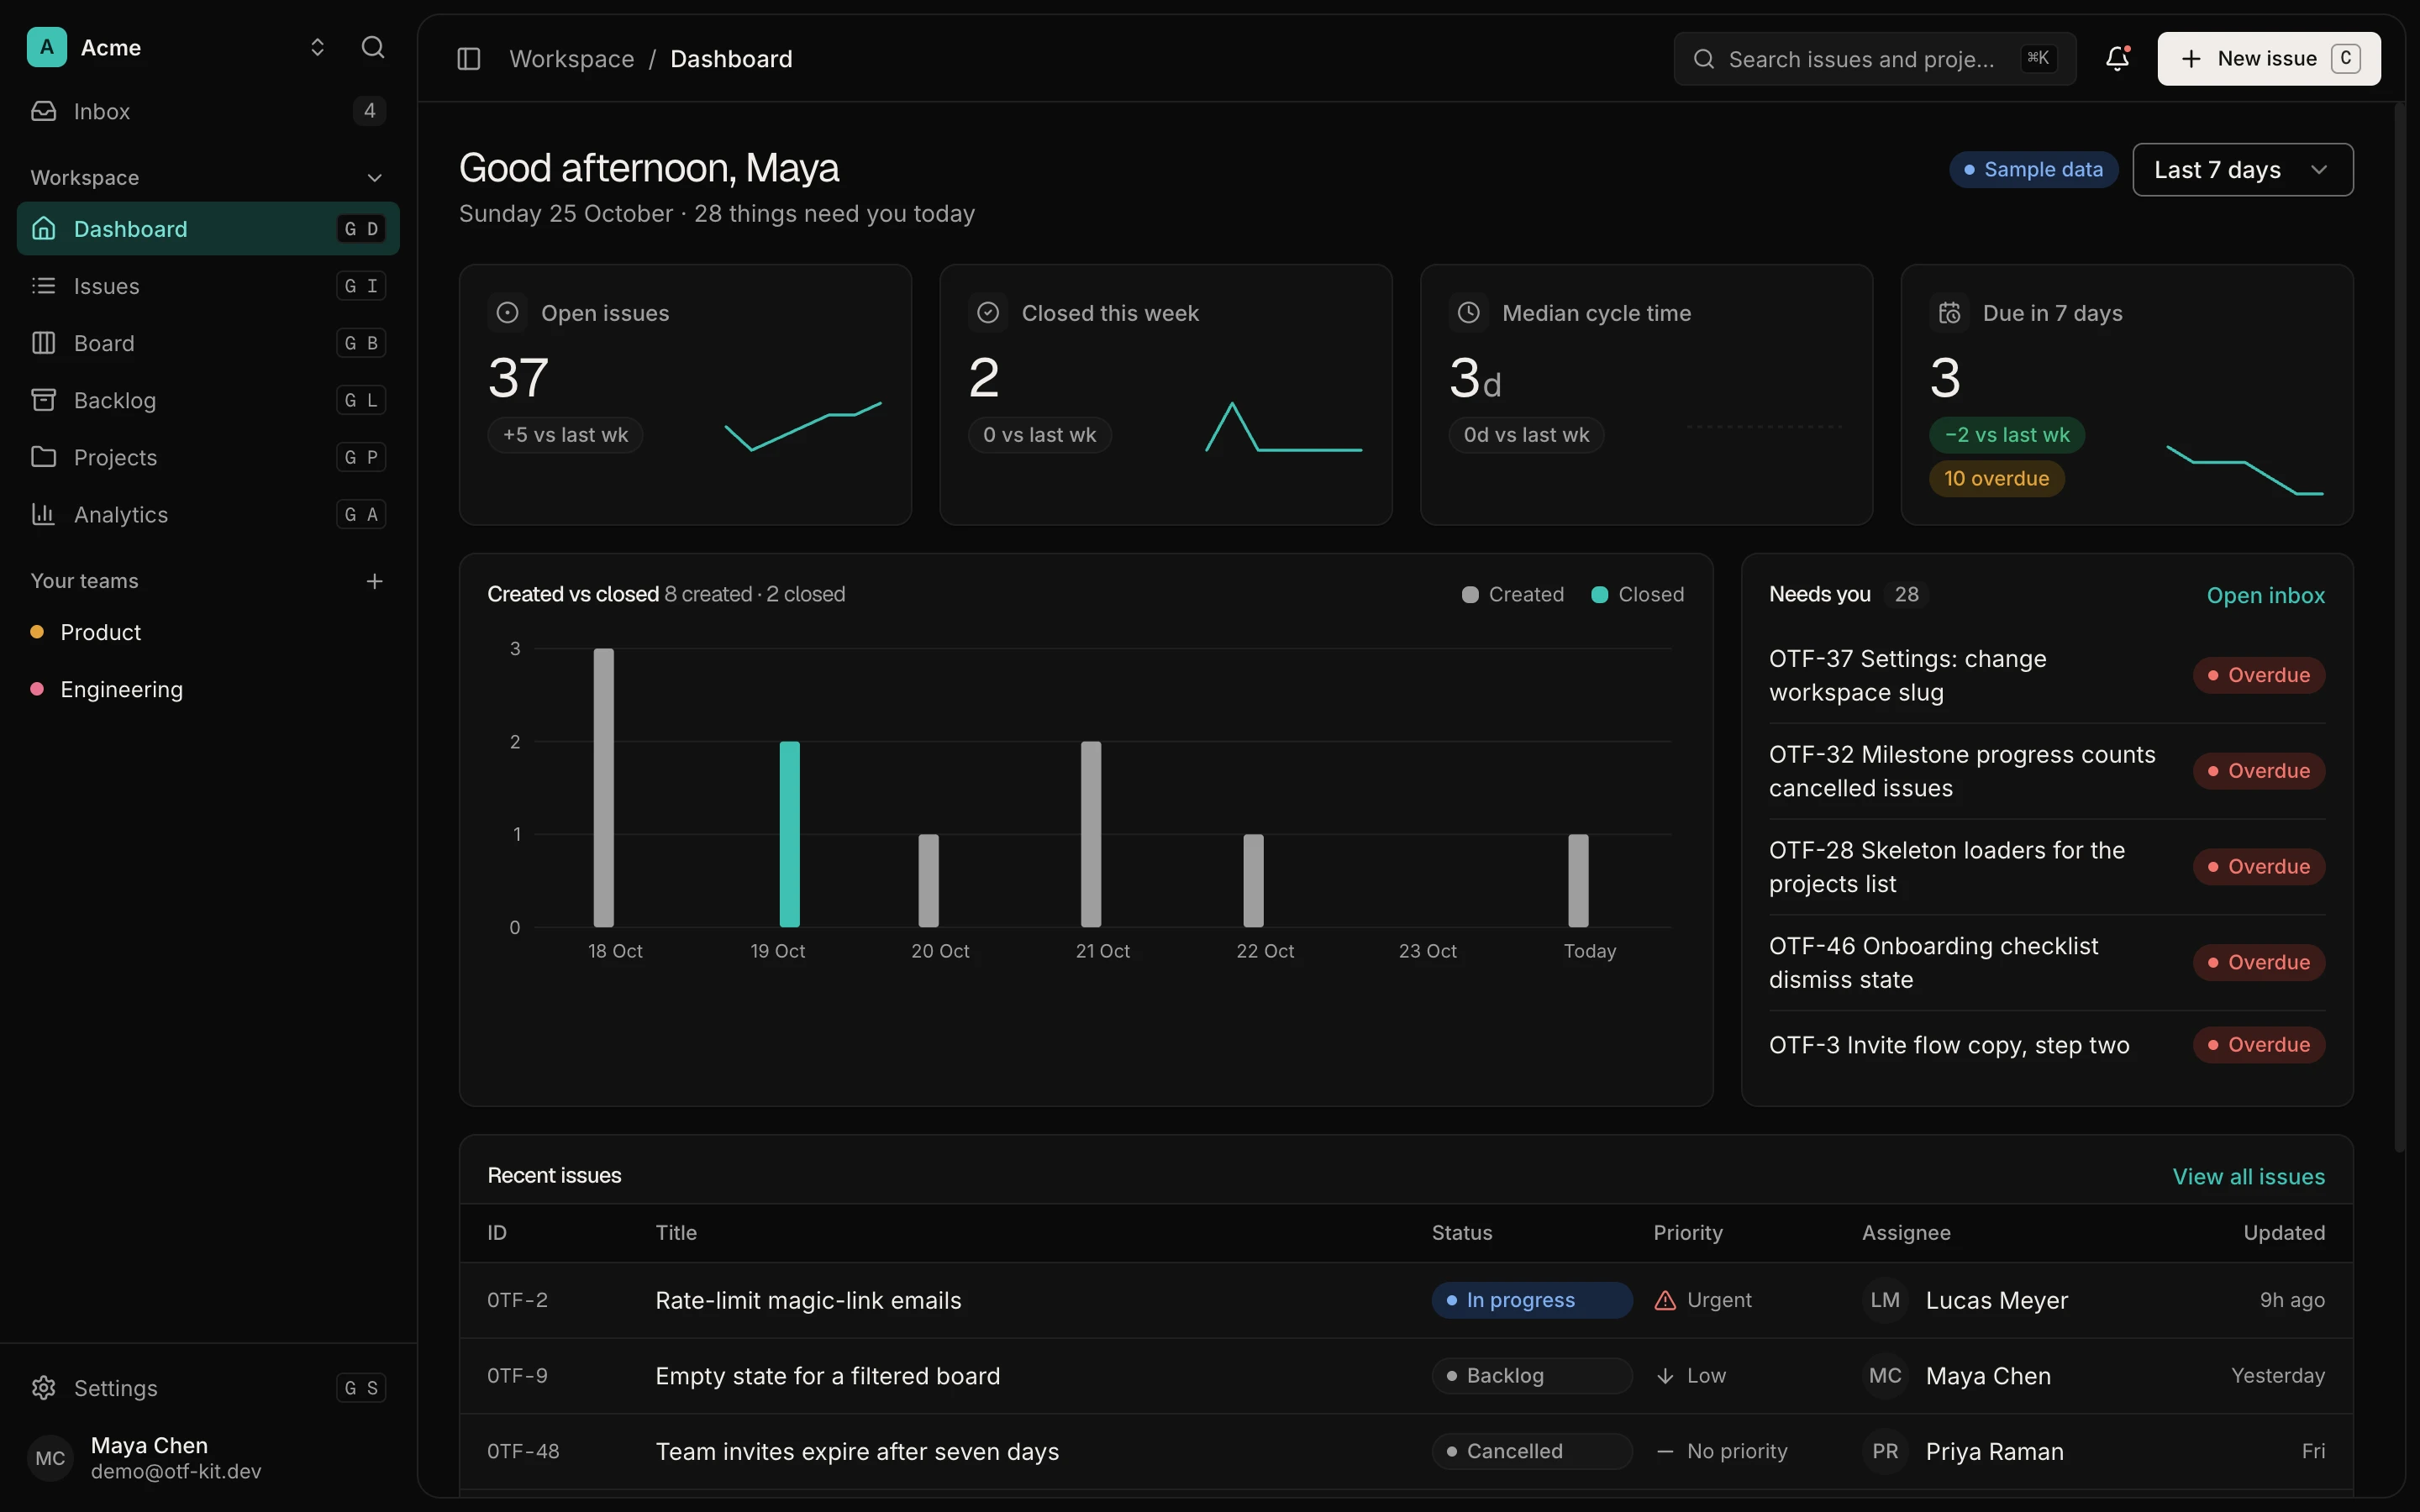
- Screens: landing, auth, dashboard KPIs (AreaChart + BarChart + Timeline), analytics (
/home/analyticswith BarChart / LineChart / BarList / ActivityHeatmap), issues, inbox, projects, teams, and settings - Data plane: Postgres schema, migrations, seed data, and query hooks per entity — including workspace, team, project, issue, comment, notification, and savedView
- Agent handoff:
CLAUDE.md,.cursorrules, and 20+ task prompts underai/prompts/(add-chart, add-stat-card, add-heatmap, add-bar-list, add-leaderboard, add-entity) - Delivery: commercial source after purchase; Cloudflare Workers deploy script and a Dockerfile for any container host, documented in the kit
Purchase path: Stripe checkout, license email with a private GitHub invite, then clone and run locally (accept → invite → clone → install → run → deploy per templates overview).
Owned analytics app versus a rented canvas or BI host
Stay on a hosted canvas or BI workspace when the primary object is a disposable chart board, a vendor-hosted URL is acceptable, and those views do not need to live in Git. Prefer an owned analytics app when most of these flip true:
- Customers and operators work in your app, not a shared vendor analytics URL
- Metrics definitions live in schema you can migrate and query
- Charts are product screens — KPI cards, series, heatmaps — not widgets parked on a host
- Alerts remain rows and rules under your retention policy, not only host-side bells
- Maintenance happens in Cursor or Claude Code on disk, with project memory that survives the next tool switch

Canvases and BI tools remain useful. Many teams keep a rented board for one-off finance or ops views while the customer analytics surface remains the kit. Buy the kit when metrics, charts, and alerts belong in a repository you keep — same ownership thesis as booking kit: own availability, confirmations, and the agent loop. This how-to assumes you already chose "own the app."
12 production screens. Login and database wired.
The SaaS Dashboard Kit includes login, a database, and a working dashboard. Live demo at saas.otf-kit.dev.
Metrics schema first, then charts, then alerts
Anthropic's Claude Code docs state the constraint plainly: each session starts fresh, and project CLAUDE.md files carry persistent architecture and conventions. OTF's AI tool overview documents the same pattern: every kit ships CLAUDE.md, .cursorrules, and companion agent files so opening the repo does not require re-explaining the stack.
For analytics, that handoff starts at metrics schema, not a pretty chart. A chart without a durable definition is a screenshot. The kit already has the seams: Postgres + Drizzle migrations and seed; entity routers under server/routes/; TanStack Query hooks with optimistic updates; dashboard KPIs at /home/dashboard; analytics at /home/analytics. Seed is deterministic after bun run db:seed (four users, five projects, fifty issues). Demo chart series on the analytics page ship from kit mock data so the UI is reviewable before you wire production queries. Do not invent a second metrics warehouse in chat.
saas-dashboard/
  src/pages/home/   # dashboard, analytics, issues, projects, teams, settings
  src/data/         # analytics mock series for the analytics screen
  src/hooks/        # one query hook per entity
  server/routes/    # /api/* routers
  server/db/        # schema, migrate, seed
  CLAUDE.md
  .cursorrules
  ai/prompts/       # add-chart, add-stat-card, add-heatmap, add-entity, ...
  docs/
  README.md
Treat ai/prompts/ as recipes for bounded jobs — add a KPI card, wire a chart with theme tokens, scaffold an entity — not a license to redesign the data plane from a blank chat. The free SDK at https://github.com/otf-kit/sdk is the shared component layer; the paid kit is the finished analytics-capable product plus agent configs that keep the next session honest.
Once schema resolves, operators live in charts. Kit docs and the live demo show KPI cards plus AreaChart and BarChart on the dashboard, and BarChart, LineChart, BarList, and ActivityHeatmap on analytics. Chart recipes tell agents to use theme tokens (hsl(var(--chart-1)) through --chart-5). Extension rule: define or query the number from schema (or a documented mock while you migrate), then render with shipped components. Paste add-stat-card.md or add-chart.md, replace placeholders, and review the diff.
Rented canvases often advertise alerts as a host feature. That is convenient until you need thresholds in your own database, under your retention policy, queryable by your agents. Current kit docs do not list a dedicated "metric alerts" screen. What they do list today: notification rows plus Inbox at /home/inbox, toast helpers for in-session cues, and settings sections including notifications. If you need a threshold rule — metric key, operator, value, channel, created_at — add it as schema you own: table → route → hook → page (or feed existing notification types). Alerts are rows you can migrate, not a vendor screenshot.
Handoff: schema to charts to alerts to agents
The loop you own has four steps: metrics schema, charts, alerts in your data plane, then agents extending the tree instead of opening a new BI project.

- Metrics schema — open
server/db/and the entity hooks. Confirm how numbers will be computed from tables you migrate. Do not start by drag-dropping orphan widgets. - Charts — extend dashboard KPIs or
/home/analyticswithadd-stat-card.md,add-chart.md,add-heatmap.md, oradd-bar-list.md. Keep theme chart tokens. - Alerts — start from Inbox notifications and toast patterns. If you need threshold rules, add them through schema and routes, then surface unread state in the sidebar badge path the kit already uses.
- Agents — every later change starts from
CLAUDE.mdandai/prompts/. The live URL should serve your clone, not a hosted canvas.
A concrete first session after purchase
After you accept the GitHub invite from checkout, the first hour should look boring on purpose. Templates overview documents clone, install, and local run. Kit docs document generate, migrate, and seed before demo data is live. Required env includes DATABASE_URL and Better Auth secrets. Stripe variables are optional, commented entries; product billing is not shipped in the kit.
git clone <your-private-saas-dashboard-repo>
cd <saas-dashboard>
bun install
cp .env.example .env
# fill DATABASE_URL and the required auth secrets (Stripe is optional)
bun run db:generate
bun run db:migrate
bun run db:seed
bun dev
Open the repo in Cursor or Claude Code. Do not start with a blank "rebuild an analytics dashboard from scratch" prompt. Point the agent at the shipped docs:
Read CLAUDE.md and ai/prompts/. Then:
1) Keep metrics definitions on schema + query hooks — do not invent a second warehouse
2) For a new KPI, use add-stat-card against the existing dashboard page
3) For a new series, use add-chart / add-heatmap / add-bar-list with theme chart tokens
4) For threshold alerts, extend notification rows or add an entity; do not fake alerts only in the UI
5) Do not bypass schema → route → hook → page order
That prompt works because the kit already names the hard seams. When local preview matches — inspect https://saas.otf-kit.dev first if you have not bought yet — follow the README deploy section (bash scripts/deploy-worker.sh for Cloudflare Workers, or the Dockerfile on any container host). The live URL should serve your repository; the next metric or alert change is another agent session on the same tree.
What "you actually own" means for analytics
Ownership here is operational: metrics definitions, chart pages, and alert rows live in Git and Postgres under your org; CLAUDE.md, .cursorrules, and ai/prompts/ reload every session; new metrics follow schema → route → hook → page with theme chart tokens; commercial rights are a one-time kit purchase (Bundle includes saas-dashboard — confirm on https://otf-kit.dev/pricing); and swapping Cursor for Claude Code does not require rebuilding project memory in a vendor UI.
Compare that to the rented-canvas loop: drag charts onto a host, share a BI URL, then hope export stays enough when analytics must be the product. The kit inverts the order — schema, screens, and prompts arrive first; agents edit second.
saas-dashboard is the analytics and admin product lane — not a $9 landing template, and not the booking or fitness kits. For the builder versus product-repo comparison, read https://otf-kit.dev/blog/otf-vs-retool-appsmith-dashboard. For the ops-admin how-to, see https://otf-kit.dev/blog/how-to-build-an-admin-panel-with-ai. If you already need owned metrics schema, charts, and alerts in a repo agents can extend, start on https://otf-kit.dev/templates/saas-dashboard, open the live demo, and buy when the screen set matches.
Sources
- SaaS Dashboard GETTING_STARTED — required env is
DATABASE_URLand auth; Stripe payment vars are commented optional examples, checked 9 October 2026.
SaaS Dashboard Kit product page: https://otf-kit.dev/templates/saas-dashboard
SaaS Dashboard Kit docs: https://otf-kit.dev/docs/templates/saas-dashboard
Templates overview: https://otf-kit.dev/docs/templates/overview
Pricing: https://otf-kit.dev/pricing
AI tool integration: https://otf-kit.dev/docs/ai-tools/overview
Anthropic Claude Code memory: https://docs.anthropic.com/en/docs/claude-code/memory
Related compare: https://otf-kit.dev/blog/otf-vs-retool-appsmith-dashboard
Related admin how-to: https://otf-kit.dev/blog/how-to-build-an-admin-panel-with-ai
Live demo: https://saas.otf-kit.dev
OTF free SDK: https://github.com/otf-kit/sdk
OTF site: https://otf-kit.dev
Ship the product, not the setup.
- 12 production screens — auth, team, analytics, and settings
- Login and a real database are wired in
- AI configs pre-tuned so your agent extends instead of regenerates
Ship your first screen tonight — free starter in your inbox
The quickstart, the SDK repo and the live kit demos, on this screen and in your inbox.
No spam. Unsubscribe any time.