
EAS Observe in production: tie startup metrics to every build and update

Crash reporters tell you when the binary died. They stay quiet when an OTA makes the home screen take three seconds longer on mid-range Android. That gap is where most "the app feels worse" tickets come from — and where release blame usually dissolves into guesswork across three native builds and two JavaScript updates.
This post is the production wiring guide for EAS Observe (expo-observe): install it, call markInteractive() honestly, read release markers next to cold/warm launch and TTI, and keep Sentry (or similar) for mature crash triage. It complements Sentry error tracking for React Native in production and Release health for AI-built apps; it is not a substitute for staged OTA rollouts or a rollback plan.
What Observe owns (and what it does not)
EAS Observe is Expo's production performance service for real devices. Per the introduction docs, it tracks cold and warm launch, bundle load, time to first render (TTR), time to interactive (TTI), and EAS Update download time. On SDK 56+, Expo Router or React Navigation integrations add per-route render and interactive timings. You can also emit Observe.logEvent signals onto the same session timeline.
What it is not, per Expo's own when-to-use table and GA write-up:
- Development-time profiling (use React Native DevTools / Expo Atlas)
- A full APM or backend trace product
- Session replay or product analytics
- A reason to delete Sentry tomorrow — Expo's marketing FAQ is explicit that Observe owns the EAS pipeline view while crash reporters still own deep error workflows
Platforms: Android, iOS, and tvOS. Not Expo Go — you need a development or production build because expo-observe is a native module. Prerequisite: Expo SDK 55+ and an EAS project (extra.eas.projectId).
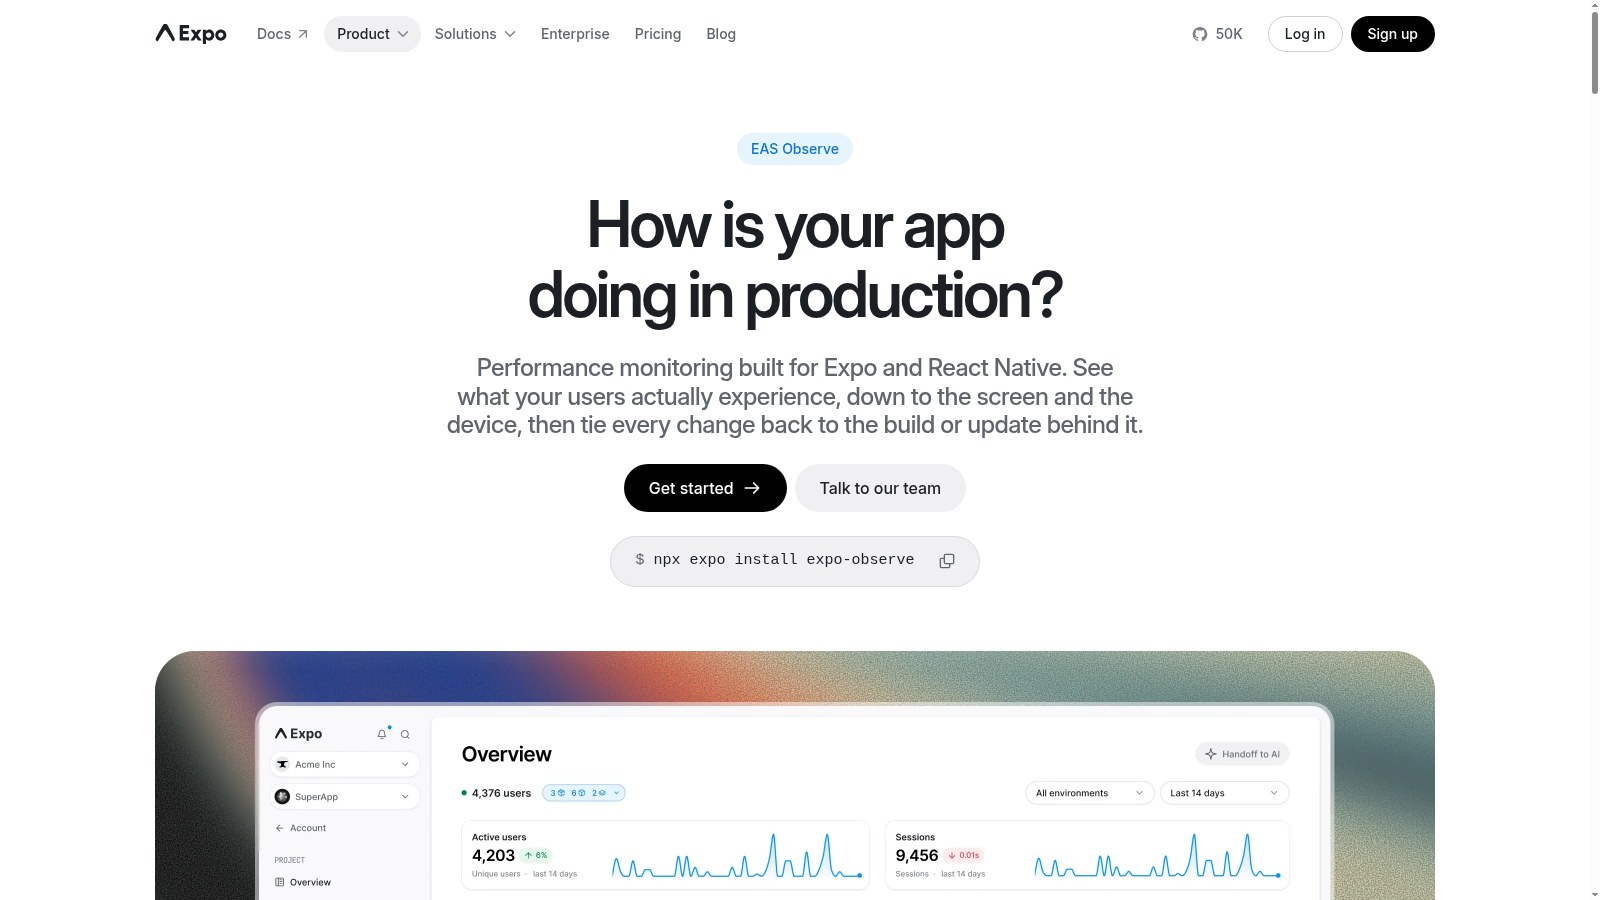
Source: https://expo.dev/services/eas-observe — public marketing page captured 2026-09-15.
Why mobile monitoring needs build + update identity
On the web, one deploy often means one active version. Mobile is messier: users update on their own schedule, and EAS Update layers JavaScript on top of native binaries. Three native releases plus two updates can mean five active combinations in the field. A monitoring tool that only knows a marketing version string averages those combinations into one p90 and hides which OTA moved the needle.
Observe's differentiator (stated on both the service page and GA announcement) is release attribution: every metric is joined to the EAS build and update that produced the session. Markers land on the chart when the first event for that build or update arrives. That is the failure mode crash tools miss — a JS update that does not crash but raises TTR/TTI.
If your release process already stages OTAs, keep that discipline: Staged OTA rollouts catch bad Expo updates before everyone gets them. Observe tells you which update hurt; staging limits who gets hurt first.

One codebase. iOS, Android, and web.
The Fitness Kit ships with auth, a database, and a backend already connected — no setup. Live demo at fitness-preview.otf-kit.dev.
Install and wrap the root (SDK-aware)
npx expo install --fix
npx expo install expo-observe
SDK 56 and later
import { Stack } from 'expo-router';
import { ObserveRoot } from 'expo-observe';

function RootLayout() {
  return <Stack />;
}

export default ObserveRoot.wrap(RootLayout);
SDK 55
Use the legacy names: AppMetricsRoot.wrap(RootLayout) instead of ObserveRoot.
Wrapping measures TTR for you. Launch (cold/warm) and bundle load arrive with the native library. TTI is the one metric you must mark yourself — only your code knows when splash work, auth, and first data are done.
Call markInteractive() when the app is actually usable
From the get started guide:
import { Stack } from 'expo-router';
import * as SplashScreen from 'expo-splash-screen';
import { ObserveRoot, useObserve } from 'expo-observe';
import { useEffect, useState } from 'react';

SplashScreen.preventAutoHideAsync();

function RootLayout() {
  const [isReady, setIsReady] = useState(false);
  const { markInteractive } = useObserve();

  useEffect(() => {
    async function prepare() {
      try {
        await authenticateUser();
        await fetchInitialData();
      } catch (e) {
        console.warn(e);
      } finally {
        setIsReady(true);
      }
    }
    prepare();
  }, []);

  useEffect(() => {
    if (isReady) {
      SplashScreen.hide();
      markInteractive();
    }
  }, [isReady, markInteractive]);

  if (!isReady) return null;
  return <Stack />;
}

export default ObserveRoot.wrap(RootLayout);
Rules that bite teams in production:
- Call it after splash work finishes — update checks, auth, first fetch, splash animation.
- Multiple entry screens (onboarding, login, deep links): call
markInteractiveon each. Only the first call in a session records; if the deep-linked screen never calls it, that session has no TTI. - SDK 56+ with navigation integration: move
markInteractive()into screen components. A call outside a screen records nothing for route-scoped TTI; app-wide TTI still depends on those screen calls. - Frame/slow-frame context attaches to the TTI event — no
markInteractive()means no frame data for that screen.
Router integration and configuration (one configure call)
On SDK 56+, enable per-route metrics once at module scope before any screen mounts:
import { Observe } from 'expo-observe';

Observe.configure({
  integrations: { 'expo-router': true },
  // sampleRate: 0.25, // optional: deterministic per installation
  // dispatchInDebug: true, // only while testing instrumentation
});
Important details from the configuration docs:
- Each
Observe.configure()replaces the whole config — keep a single call. sampleRateis deterministic per installation, not per session. Out-of-sample devices drop pending metrics.- Debug builds do not dispatch by default.
dispatchInDebug: trueis for verifying plumbing; leave it off in production or you pollute medians with simulator/dev timing. - Offline metrics buffer on device and flush on background (or via
dispatchEvents()). - Users are anonymous install IDs — not PII, reset on reinstall. You can find a bad session; you cannot name the customer from Observe alone.
Rebuild after install. Expo is clear: turning Observe on requires a new binary; you cannot flip it from eas.json alone today.
Read the dashboard and CLI like a release engineer
After traffic hits a release build, open the project's Observe tab. Useful CLI companions (see get started):
eas observe:versions
eas observe:metrics-summary
eas observe:metrics
eas observe:routes
eas observe:session
eas observe:events
Practical loop:
- Compare median cold launch / TTI for the latest build or update vs the previous marker.
- Sort slow sessions (
eas observe:metrics) and check device, thermal state, network, low-power mode — fields web APM tools often omit. - Use
eas observe:routeswhen one screen (not "the app") is the regression. - Check the Update downloads view when TTI spikes after an OTA — a large asset on cellular can look like "slow React" when it is download time.
Expo also ships a Hand off to AI flow that copies dashboard context into a prompt for Cursor/Claude/Codex, plus Expo Skills (eas-observe / setup, metrics, queries). Useful when you already trust agents in the repo; still verify the release ID yourself before blaming a teammate's PR.

Errors preview: keep Sentry in the stack
On SDK 57+, Observe can record JavaScript errors (unhandled automatically; render errors via ObserveErrorBoundary / ObserveRoot's errorBoundaryFallback; handled via Observe.reportError). Native crashes are recorded with expo-observe 57.0.21+ on Android/iOS (not tvOS / iOS Simulator; ANR and OOM not recorded yet). This path is in preview.
For symbolicated JS stacks from EAS Build:
{
  "build": {
    "production": {
      "uploadSourceMaps": true
    }
  }
}
Requires EAS CLI 22.0.0+ and cloud EAS Build (not --local). Source maps for EAS Update errors and native symbol upload (ProGuard/dSYM) are still listed as coming later. Native stacks in the dashboard are not fully symbolicated the way Sentry users expect.
That is why this post links the Sentry checklist instead of replacing it: Sentry error tracking for React Native in production, crash triage that ships fixes, and error boundaries that hold. Observe answers "which build/update made startup or this route worse?"; Sentry still answers deep crash grouping, alerting maturity, and native symbolication workflows many teams already run.
Production checklist
- SDK 55+ and
extra.eas.projectIdpresent (eas initonly if you intend a new project). npx expo install expo-observe; wrap root withObserveRoot/AppMetricsRoot.markInteractive()on every entry screen after splash/auth/data ready.- SDK 56+: one
Observe.configure({ integrations: { 'expo-router': true } })at module scope. - Ship a new development or production build (not Expo Go).
- Confirm events in Observe tab; optionally
eas observe:metrics-summaryfor the new version. - Keep staged rollouts + rollback for OTAs; use Observe markers to see if an update stepped TTI.
- Keep Sentry (or equivalent) for crash workflows; enable Observe errors preview only if you accept preview limits and set
uploadSourceMapswhere appropriate. - Leave
dispatchInDebugoff in production. - If volume is high, set a stable
sampleRateand document which fraction of installs you trust for percentiles (Expo does not reweight undersampled percentiles).
Decision rule
Add Observe when you ship Expo apps on EAS and need production startup/route metrics attributed to builds and OTAs. Skip it (for now) if you are still on SDK 54 or earlier, live only in Expo Go, or your only pain is crash volume with no release-performance questions.
Pair it with release hygiene you already own: health verdicts per build (release health), staged updates, and an explicit rollback plan. The metric without a rollback path is just a sad chart.
Sources
- Introduction to EAS Observe
- Set up EAS Observe
- Configure EAS Observe
- Error reporting (preview)
- EAS Observe product page
- Introducing Observe (GA announcement)
- Internal: Sentry RN production checklist, crash triage, release health, staged OTA, rollback plan, error boundaries
Stop wiring. Start shipping.
- Login, database, and backend already connected — nothing to set up
- iOS + Android + web from one codebase
- AI configs pre-tuned + 40+ tested prompts included