I Built ReactoRadar, A Modern React Native Debugger For Hermes & New Architecture

ReactoRadar React Native Debugger: The Modern Debugging Tool for Hermes & New Architecture in 2026
React Native debugging needed a rethink. Flipper’s deprecation, the incompatibility of React Native Debugger with Hermes, and the lack of network/Redux support in Chrome DevTools left developers stuck in a maze of tools that never quite did the whole job. The ReactoRadar React Native debugger genuinely solves this: a standalone macOS app for React Native 0.74+ that “just works” with the Hermes engine and the new JSI-based architecture. No plugins. No config. One command and you’re debugging—with full support for consoles, network, Redux state, and AsyncStorage. If you’re building React Native apps today, you’re overdue for a tool that fits 2026.
What is ReactoRadar and why does it matter for React Native debugging in 2026?
ReactoRadar is a purpose-built, standalone macOS desktop debugger for React Native 0.74+—with full, native support for Hermes and the New Architecture. Where developers once chained together Flipper, outdated debuggers, and Chrome DevTools just to probe the basics, ReactoRadar positions itself as the “all-in-one” answer for current React Native workflows. This matter is direct: ReactoRadar fills the post-Flipper vacuum and leapfrogs existing tools in integration and minimal setup.
Most debugging pain in React Native today is a direct result of architectural churn. Hermes (now the only recommended JS engine) broke backward compatibility with legacy debuggers, and Meta has officially deprecated Flipper. The “old” React Native Debugger does not support Hermes at all; Chrome DevTools limits you to logs, missing any view into Redux, network, or AsyncStorage.
ReactoRadar’s significance is in erasing all this friction. The setup is zero-config—no native modules, no build-time plugins, no configuration files. You run npx reactoradar setup, launch the desktop app, and immediately get a connected, interactive debugger purpose-built for modern React Native. In short: it’s the first debugger that’s actually congruent with how React Native apps are built and run in 2026.
Which debugging features does ReactoRadar support?
ReactoRadar’s feature set addresses every major pain left behind by deprecated or incompatible tools. It’s not a patchwork—each panel is natively implemented, performance-minded, and modeled after Chrome DevTools’ best interaction patterns.
Console
Forget flat log text. The ReactoRadar console displays logs as fully interactive, collapsible trees—matching the object explorer UX you expect from Chrome DevTools but never found in React Native before.
- Objects are expandable to any depth. Click to copy any value, including deeply nested nodes.
- Multi-select log level filter (persisted across restarts), so you can leave lurking errors visible even as you silence noisy info/debug chatter.
- A real Cmd+F search: fast, prev/next navigation over thousands of logs, with highlighted results.
// Example: Open the console, search for 'Auth', and expand an object
console.log({type: 'Auth', token: 'abc...xyz', nested: {expires: 12345}});
The takeaway: your log inspection in React Native is finally DevTools-grade—structured, filterable, navigable.
Network Inspector
Here’s where legacy debuggers flatlined: trying to make sense of fetches, images, or XHRs hitting your stack. ReactoRadar embeds a modern, full-network inspector:
- Tabular display (Name / Status / Type / Size / Time / Waterfall) with resizable and sortable columns.
- Clicking on any request reveals a panel: Headers, Request Body, Preview (tree), Response. Direct interaction, not a JSON blob.
- Right-click any request → “Copy as cURL” for instant terminal reproduction—critical for API debugging.
- Filters by type (Fetch/XHR, JS, CSS, Img, Media, Font, Doc, WebSocket).
- Simulated network throttling directly on the connected device: Fast 3G, Slow 3G, or Offline.
It captures everything, including fetch, raw XMLHttpRequest, and all variants of axios—even axios.create instances.
// Example: Testing axios network traffic
import axios from 'axios';
axios.get(');
You get a full, transparent view of network life—no more “why didn’t this request appear?”, no more guessing whether your middleware is working.
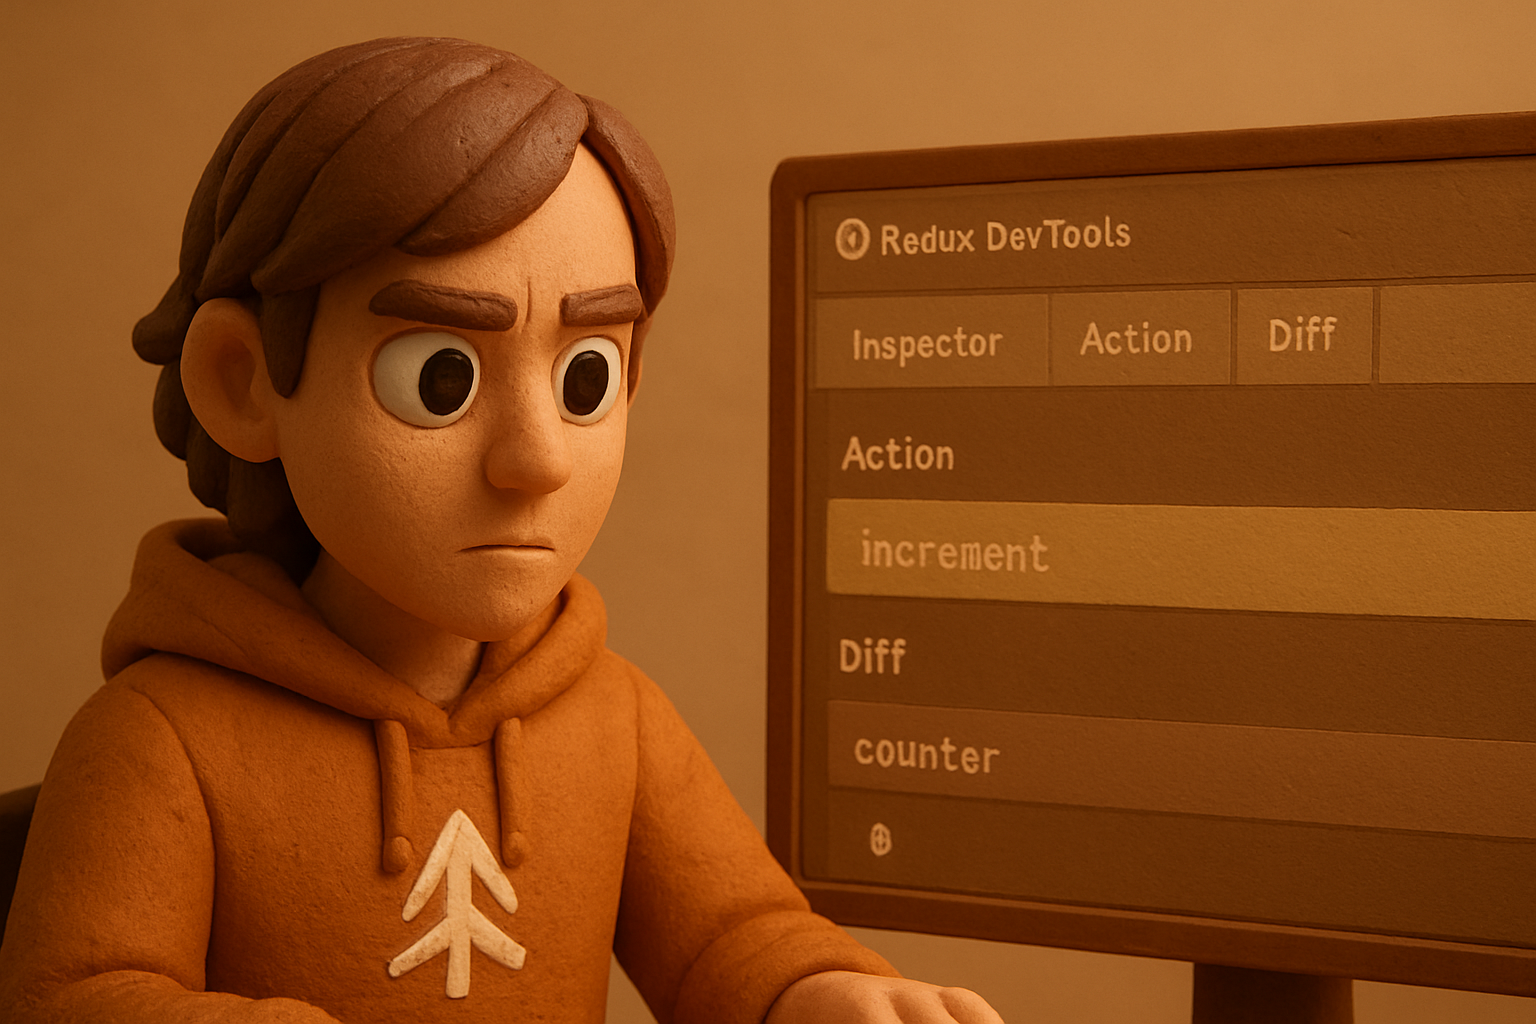
Redux DevTools
Every Redux action, highlighted and searchable. Click an action, see:
- The payload as a collapsible tree.
- All changed store keys, with actual before/after (values in red where changed).
- Deep equality comparison: only “true” diffs appear—false positives from Redux’s shallow updates are gone.
// Example: Redux action debugging in ReactoRadar
dispatch({ type: 'LOGIN_SUCCESS', user: { id: 123, name: "Alicia" }});
This is the Redux devtools you wish you’d had for mobile, integrated with no setup.
AsyncStorage Viewer
No more writing one-off components to poke at key/value pairs: ReactoRadar covers this with a searchable, scrollable AsyncStorage explorer—one click to inspect, copy, or delete keys.
Persistent Log Filtering and Copy
Filters you set (error, warn, info, debug) persist across restarts, and you can batch-select and copy sets of logs—vital for long-running bug sessions or sharing traces with teammates.
Summary
Every debugging surface—console, network, Redux, AsyncStorage—exists as a first-class, low-friction panel. That’s the standard that legacy tools never approached.
One codebase. iOS, Android, and web.
The Fitness Kit ships with auth, a database, and a backend already connected — no setup. Live demo at fitness-preview.otf-kit.dev.
How does ReactoRadar work with Hermes and React Native New Architecture?
ReactoRadar’s foundational design is full compatibility—it works out of the box for any React Native project running 0.74+ with Hermes enabled, and it understands the New Architecture.
- Minimum version: React Native 0.74, with Hermes engine active (the default in 2026 RN projects).
- Real JSI support: Handles apps using the “new” JSI-based New Architecture without any special adapters or bridges.
- No need for bridging native modules, or touching Xcode/Android Studio. That means cross-team onboarding overhead is eliminated.
- No build-time plugins. No post-install steps. This isn’t another source patch; it’s an overlay that interacts with the runtime in-place.
Performance isn’t a footnote: because of native Hermes integration, ReactoRadar extracts logs, network events, mutation diffs, and storage changes directly from the engine’s exposed surfaces—no slow polling, no proxy hacks.
The result: improved debugging responsiveness and fidelity—you see what’s happening in the engine, not an approximation based on unreliable hooks.
How to install and use ReactoRadar in your React Native project today
Getting started with ReactoRadar takes precisely two commands. No config files. No dependency injection. No plugin registration.
Step 1: Set up your React Native project (must be React Native 0.74+ with Hermes)
npx reactoradar setupThis hooks up the minimal support scripts, ready for macOS desktop debugging.
Step 2: Launch ReactoRadar from your terminal
npx reactoradarThe standalone ReactoRadar app opens. Your running simulator or device (iOS/Android, so long as Hermes is enabled) appears as an attachable session—one click and you’re live-debugging.
Daily workflow:
- Console: Watch logs as you trigger actions in your app; filter and search as needed. Expand JavaScript objects in-place.
- Network: Trigger fetches or images; see all outgoing/incoming requests in sortable panels. Test API failures using network throttling.
- Redux: Track state changes in Redux apps. Click actions to drill into payload and diffs.
- AsyncStorage: Query, filter, and edit your client-side storage without leaving the debugger.
- Share: Copy cURL requests or log snippets for teammates and bug reports.
Requirements:
- macOS desktop (ReactoRadar is presently a macOS app)
- React Native 0.74 or later, with Hermes enabled
No other dependencies—this is the leanest, most reliable path to integrated React Native debugging.
How does ReactoRadar compare to other React Native debugging tools?
Here’s a summary table, based on the current (2026) ecosystem state:
| Tool | Hermes Support | Network Inspector | Redux Panel | AsyncStorage | Setup Overhead | Status |
|---|---|---|---|---|---|---|
| Flipper | Partial | Yes | Yes | Yes | Moderate (plugins) | Deprecated |
| React Native Debugger | No | Limited (logs) | Yes | Yes | Moderate (bridge) | Legacy |
| Chrome DevTools | Yes | Logs Only | No | No | None | Supported (logs) |
| ReactoRadar | Full | Full | Full | Full | None | Active |
- Flipper: officially deprecated by Meta; plugin ecosystem stale; build and config overhead; only partial Hermes/New Architecture support.
- React Native Debugger: never supported Hermes; limited to legacy engines; Redux state/AsyncStorage are only as good as the bridge allows.
- Chrome DevTools: operates as a log monitor. No Redux/network state visibility. Useful for console-level poking, nothing more.
- ReactoRadar: the only current option offering full-spectrum support for Hermes, network, Redux, and AsyncStorage—in one macOS app, with zero setup. No plugins, no config files, no deprecated bridges.
The takeaway: ReactoRadar consolidates all the fragments, replaces build-time fiddly steps with simplified commands, and targets the real world of 2026 React Native.
What’s next for ReactoRadar and React Native debugging?
ReactoRadar’s design is future-facing. The developer hints at ongoing enhancement and alignment with the React Native project’s 2026+ evolution: support for new surfaces as New Architecture matures, deeper Redux integration, and even more performance visualization tools are likely on the roadmap. While official community contribution isn’t explicitly stated, the open development approach suggests community involvement could emerge as use grows. The focus is clear: as React Native moves forward, ReactoRadar will shadow its new features and idioms—no risk of being orphaned or deprecated out from under you the way Flipper was.
Why stability under churn matters (and why OTF complements, not replaces)
ReactoRadar demonstrates how fast, reliable debugging can finally keep pace with React Native’s shifting internals. But one thing never changes: logs, state, and network flow are your first line of defense, not your infrastructure. If you base crash tracking or production state capture on “whatever devtools happens to work this week,” you’ll spend more time debugging your debugger than your app. The OTF event pipeline acts as the durable, runtime-agnostic foundation—logging, replay, and state capture that won’t fragment or break with another engine, engine version, or architecture shift. Debug fast with ReactoRadar locally. Track, analyze, and alert with an OTF-backed pipeline across devices and releases. The baseline: use the new, and keep the core solid.
ReactoRadar delivers what old tools only threatened—a true, all-in-one debugger for React Native Hermes and New Architecture apps as they are actually built in 2026. Death to config files and abandoned plugins. If you’re still stringing together three tools for one trace, it’s time to give ReactoRadar a real-world trial—debug faster and move in step with React Native’s evolution, not behind it.
Stop wiring. Start shipping.
- Login, database, and backend already connected — nothing to set up
- iOS + Android + web from one codebase
- AI configs pre-tuned + 40+ tested prompts included